Dashboard COVID-19 in schools
About
Description
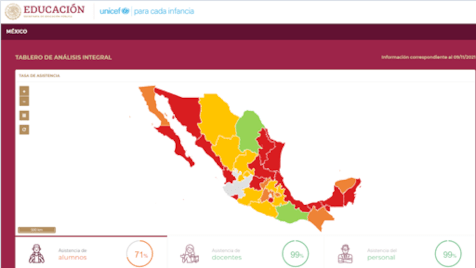
The project aimed to create a dashboard to display and track real-time information on key indicators linked to COVID-19 in Mexican schools. Indicators were presented at the level of national and sub-national administrative divisions, as well as for individual schools. The dashboard was intended to be widely communicated to families, associations, and the media.

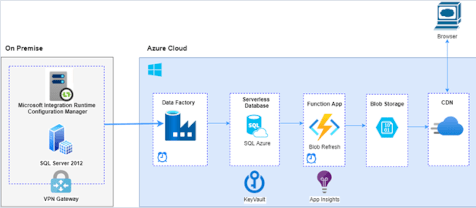
CartONG and MapAction worked on the data management and visualization process, combining Microsoft Azure cloud services with a front-end application developed using the Vue.js framework. Cloud services allowed the daily extraction of data from the central Database managed by the Ministry of Education for storage on Azure’s Blob storage tool, performing aggregation calculations in the process. The front-end application consumed and displayed the data by categories, such as general school information, COVID measures, absence rates, and sanitary conditions.

Schéma présentant le fonctionnement du tableau de bord
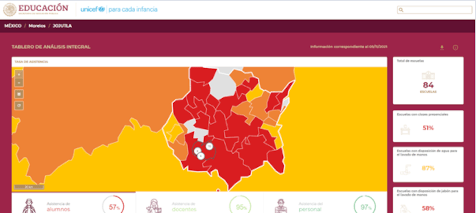
CartONG took charge of developing the front-end application, focusing on user experience design and the coordination with UNICEF. Key dashboard indicators were represented by visuals adapted to the nature of the data. The public launch of the dashboard was postponed until 2021, giving CartONG and MapAction more time to prepare the tool for the 2021-2022 school year.

One of the main challenges in developing the dashboard was to make it easily accessible to all types of users. The dashboard was adapted to all types of devices and used a color code corresponding to the Mexican Ministry of Health’s code for mapping health indicators linked to the COVID-19 pandemic. Dashboard elements such as the map and graphs could be exported, both in PDF format or CSV for the raw data.


