Monitoring deforestation in Côte d’Ivoire
About
Description
In June 2017, CartONG was chosen by the French Development Agency (AFD) to implement a technical solution for monitoring agricultural and forest plots as part of the Projet REDD+ de la Mé (PRM) implemented by the NGO NITIDÆ in Côte d’Ivoire. This project aimed to combat deforestation and improve the living conditions of local populations in the Mabi and Yaya forests.
The aim of this project for CartONG was to identify a tool that could offer a plot monitoring solution not only within the framework of the NITIDÆ project, but that could also be replicated for other NGOs in a similar context.
To ensure its potential replicability, over and above the features usually required of MDC (Mobile Data Collection) tools, such as being open source, free of charge, for offline use and on mobile devices, the tool identified by CartONG had to:
- Enable polygon trimming, so that parcels could be traced and their surface areas known,
- Enable attribute data to be entered concerning plots, owners, crops and support measures (and therefore have a suitable data model),
- Enable tracking over time, i.e. access to old records for editing,
- Display satellite imagery as a background map.
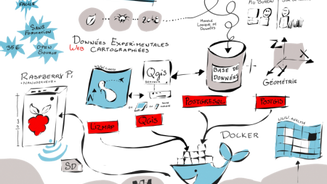
The benchmarking carried out by CartONG identified the GeoPoppy tool, as it met all the specifications. GeoPoppy is a compilation of existing tools hosted on a portable mini-server – in this case a RaspberryPi (1) powered by an external battery (2) – and displayed on a touch-sensitive tablet (3).

In October 2017, a CartONG staff was deployed to the Mé region of Côte d’Ivoire to implement the selected technical solution and train NITIDÆ teams in the field. The implementation of GeoPoppy, to ensure the Monitoring & Evaluation of the REDD+ project, was carried out in 6 steps, including 5 in the field:
- Create a data model adapted to the project to combat deforestation in the Mé region (select the indicators to be collected and organize the structuring of relationships between datasets).
- Create a QGIS project to visually display the collected data on the tablet, and configure the RaspberryPi to host the application. The final solution deployed functioned as a true on-board geographic information system, providing access to advanced functionalities such as surface digitization, links between several layers of information via unique identifiers, and access to the history of collected data.
- Train the NITIDÆ teams.
- Carry out the first field tests to collect the first data.
- Produce documentation on the use of the tool for distribution to field teams.
- Provide post-mission remote support to resolve any technical problems.
