PRIQH2
About
Description
At the end of 2018, CartONG was selected by the French Development Agency (AFD) to participate in the scientific impact evaluation (ESI) of the Program for the Rehabilitation and Integration of Housing Districts (PRIQH2 in French), to add a mapping dimension to the program’s evaluation methodology.
CartONG work consisted of two main activities:
- Consolidating a geographical database and developing mapping tools to analyze the impact of the program
- Strengthening the capacities of the local partner in GIS and promoting the appropriation of the tools developed within the framework of the evaluation to go beyond their primary goal – of being monitoring and evaluation tools – so they could also be used to facilitate decision-making and institutional dialogue.

CartONG began its intervention by diagnosing the cartographic and statistical data available to the Tunisian Rehabilitation and Urban Renovation Agency (ARRU) and its partners. We centralized this data in a GIS Database dedicated to ESI. We supplemented this database with additional open data available, notably from OpenStreetMap.
We then defined impact indicators to provide a more nuanced view of neighborhood changes, considering factors such as the distribution of land use, the structure of the road network, and the built-up and vegetated areas in and around the intervention zone, available, notably from OpenStreetMap.
We then defined impact indicators to provide a more nuanced view of neighborhood changes, considering factors such as the distribution of land use, the structure of the road network, and the built-up and vegetated areas in and around the intervention zone.
We selected 10 neighborhoods for our study sample, taking into account the different urban situations of the neighborhoods and their inclusion in a wider “territory of belonging”, which has a strong influence on the social and economic reality of these neighborhoods.
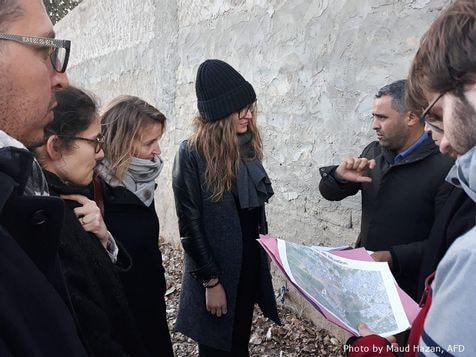
To be able to carry out fine, quantifiable analyses that would feed into the pre-identified ESI impact indicators, we then created the missing data by mapping the neighborhoods in our study sample in detail. Using satellite imagery, CartONG mapped roads, buildings, land use and vegetation cover. To carry out this mapping on a neighborhood scale, we defined and standardized a mapping method.
We helped ARRU’s GIS team get to grips with the method and data entry tools, which in turn helped us map the various neighborhoods, particularly the buildings.

Between 2021 and 2022 we developed mapping tools to analyze the impact of PRIQH2. The GIS Database we consolidated between 2019 and 2020, on our study sample, enabled us to produce accurate maps of the neighborhoods in our sample. The maps illustrate and characterize the situation of the neighborhoods and their surroundings before the PRIQH2 rehabilitation work began. The maps also enabled us to feed the selected spatial impact indicators through statistical processing of the cartographic data.
We have set up a process that automatically generates maps and analyses illustrating and measuring the baseline situation of the neighborhoods in our study sample. Our aim, as for the rest of our intervention, was to set up lightweight GIS tools that could be easily appropriated by ARRU. Initiation and support for this workflow was offered as part of our support for ARRU’s GIS capacity-building.
Finally, in 2022, we finalized the baseline report, consisting of a series of maps and spatial analyses characterizing the referral situation of the 10 neighborhoods in our study sample.
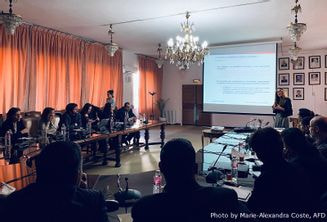
In view of the diagnosis of ARRU’s GIS (notably GIS under-integration, lack of available information, need at the project identification phase), the content of the capacity-building component has been adapted from the initial proposal. Indeed, it appeared to be a necessary prerequisite to enable ARRU to make GIS a collective issue and to share the common interest of such a tool. It was therefore proposed to organize a collaborative workshop involving all ARRU professions. Following this workshop, a final training course was proposed, focusing on light cartographic tools for collecting the missing geographic data required for the project in the field, in an organized and standardized way.
