Collecte de données

Nous accompagnons vos équipes pour donner une autre dimension à vos projets !
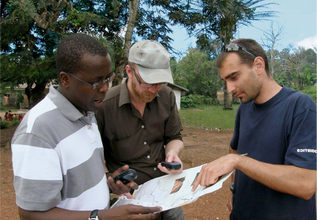


Diagnostic des besoins, développement d’outils, production de cartes, soutien opérationnel et stratégique.
Voir le détail
Formations sur mesure, sur site ou à distance, mises en situation pratique,…
Voir le détail
Mise à disposition et développement de ressources, ateliers et événements d’apprentissage, webinaires.
Voir le détail
Nous travaillons avec plus de 40 partenaires référents dans le domaine de l’humanitaire et du développement.
Suite à plusieurs années d’échanges qui ont pris de l’ampleur en 2023, marqués notamment par une rencontre inter-équipes, le F3E…
Après deux décennies d’activité dans le secteur de la solidarité internationale, CartONG a le plaisir d’annoncer sa nouvelle identité visuelle…
La collaboration avec nos partenaires et leur autonomie sont prioritaires pour nous !
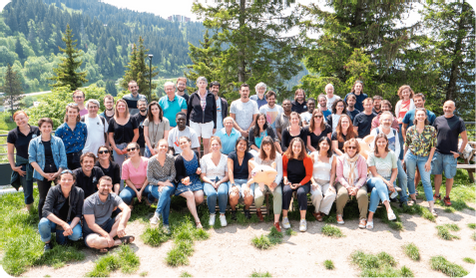
Plus de 40 salariés, et plus de 60 bénévoles vous accompagnent dans la réalisation de vos projets.