Data visualization for the Innov’i project

Focus on the Innov’i project
This is a 5-year initiative, implemented in Tunisia, aiming to support innovative and local entrepreneurship through 3 components. The first one, the most important one, aims at providing financial support to organizations whose mission is to accompany entrepreneurship, while the second one aims at participating in the structuring of a regulatory framework favoring entrepreneurship. The last component seeks to enhance Tunisian initiatives through communication, partnership and awareness-raising actions. For more information, click here.
A request which reflects the increasing interest in data visualization in our sector
Expertise France’s request aligns with many other requests from organizations in the humanitarian and development sector over the past few years. With the rise of dashboard design software (mainly PowerBI with its integration in the Office Pack, but also Tableau, Qlik, Shiny for R, etc.), a high demand for visualization has emerged, whether to analyze the progress of activities, to better communicate around data or for inter-partner coordination purposes. The growing complexity of multi-actor projects and the increasing volume of data collected require the implementation of efficient data collection systems and powerful and flexible visualization tools to allow for close monitoring of indicators.
In the case of the Innov’i project, the main aim was to facilitate the monitoring of the activities of the various project implementation partners. In fact, reviewing and combining the 50 project indicators was taking a significant amount of time for the project team in Tunisia.
Our teams had already had the opportunity to work on several similar projects. Mobile data collection, analysis and FACET visualization tools – Water Sanitation and Hygiene (WASH) services in schools (WINS) and in health facilities (WIH) – have been developed by Terre des hommes, EAWAG and CartONG since 2016 for the SWSC. CartONG also supports several UNHCR projects (see here) on the implementation of such tools. We are therefore excited to be able to support Expertise France’s action in a different sphere than our recent support centered on M&E training (more information on this project here), and to keep developing our expertise in building integrated data collection, processing and visualization systems, especially on an entrepreneurship project like Innov’i, a first for CartONG!
What did our support consist of?

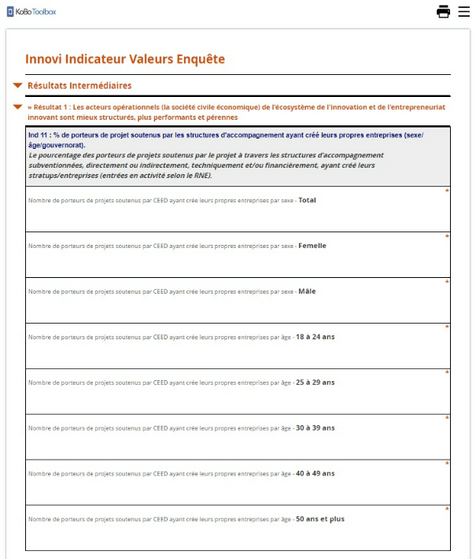
Originally, the partners had to fill out an Excel matrix that the Innov’i team collected and reconsolidated, these different steps being manual and therefore quite time-consuming. The technical scenario chosen by Expertise France among those proposed by CartONG was the following: the creation of a centralized Kobo form directly linked to a PowerBI interactive dashboard compiling the project indicators in order to visualize and communicate about the project and its advancement.
Our teams thus first focused on reviewing the existing data collection system with the objective of optimizing it while maintaining a simple user experience. By doing so, we wanted to provide a better quality, organization and consistency of data sources. We then used this new version of the data collection system to create an interactive dashboard whose generated visualizations will be published on the project website to better communicate about the project and its achievements.
Once the data collection system was reviewed, a Kobo form was created. This form was sent for validation to the Expertise France teams in charge of the Innov’I project and will allow, depending on the partner who fills it out, to display only the questions related to the indicators that concern them for the selected reporting period, and to store their data on a server. Some of the data will be transformed directly into the form (through automated calculations for example) to enable automated processing and display of the indicators.
What’s next for the project this end of year?
The dashboard is currently being developed and will be completed by October. It will be updated automatically on a regular basis and will allow the user to filter the data and generate specific breakdowns to visualize the aggregated indicators.
Following the implementation of the data collection and visualization system, CartONG will provide training to all teams involved in the use and maintenance of the tools created during the project. The last phase of our support, focused on the creation of survey forms to better assess the impact of the various activities of the Innov’i project – particularly in terms of training and coaching – will allow CartONG to mobilize its expertise in regards to survey methodology, especially to improve the monitoring of the quality of the surveys implemented by the Tunisia-based project.